What are Degree Days?
Degree days are a simplified form of historical weather data. Despite their importance for monitoring and modeling the relationship between outside temperature and energy consumption, they are widely misunderstood and underused.
Weather conditions account for 50% - 70% of energy use variability in buildings. In other words, majority of energy use fluctuation we see on day-to-day bases is caused by changes of outdoor temperature.
Degree days simply indicate how much heating or cooling is required in a given period of time in a particular location. They come in two forms, Heating degree days (HDD) and Cooling degree days (CDD).
For those who are interested in how they are calculated, a Heating degree days are calculated by subtracting daily average temperature from base temperature and multiplying it by the number of days. Cooling degree days are calculated by doing the opposite.
HDD = base temperature - average daily temperature * number of days
CDD = average temperature - base temperature * number of days
e.g.
The temperature in Prague on July 27th was 30.5 degrees celsius and we use the base temperature of 24, that is 0 heating degree days and 6.5 cooling degree days.
Why can’t we just use temperature?
The fundamental flaw in using outside temperature is the fact that different days can have the same exact average temperature with very different heating and cooling requirements. For example one day you can have a very chilly morning and warm afternoon, and another day you have mild temperature throughout the whole day. Both of those days could have the same average temperature, while their cooling/heating consumption could be drastically different.
Base-load and variable-load
Dividing total consumption by degree days is better than not using degree days at all, but it ignores an important factor. Total consumption is the sum of base-load and variable-load.
Base-load is the part of energy consumption that is necessary for building to function normally, such as server rooms, lighting in main areas or CCTV. Variable-load is the part of consumption that is influenced by energy drivers such as the occupancy of the building or heating and cooling degree days.
Therefore if you want to divide consumption by degree days, you have to isolate the part of consumption that is directly influenced by outside temperature variability (HVAC systems). You can calculate this by linear regression analysis.
Linear regression analysis
Regression analysis is used to examine the relationship between two or more variables. It not only sounds impressive but it is actually very useful in measuring and understanding building performance. Linear regression model consists of scatter plot with total monthly consumption on y-axis and degree days on x-axis, and it looks like this.
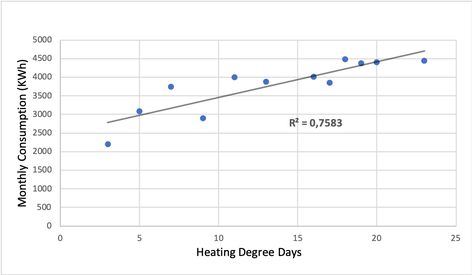
The Intercept
In statistics intercept is the point where trend line ‘intercepts’ y-axis. In energy efficiency it equals to the base-load. In this example it’s somewhere around 2,500 KWh a month.
R2 Value
This value explains the correlation between consumption and degree days. In the example above, approximately 75% of the variation can be explained by Heating Degree days.
You can also easily identify any anomalies and look into them a little deeper. Is there a reason why they don’t follow the general trend?
Slope
The slope or gradient shows the consumption required for each additional heating degree day. Sites with a higher gradient are consuming energy at a greater rate per degree day.
Understanding why some seemingly similar buildings have different slope values can indicate underlining energy-saving opportunities.
Enectiva
When choosing an energy management system it is important to choose one that understands degree days and uses them for your benefit. If you want to know more about how Enectiva uses degree days, contact us at info@enerfis.cz.